×
About Weather Station
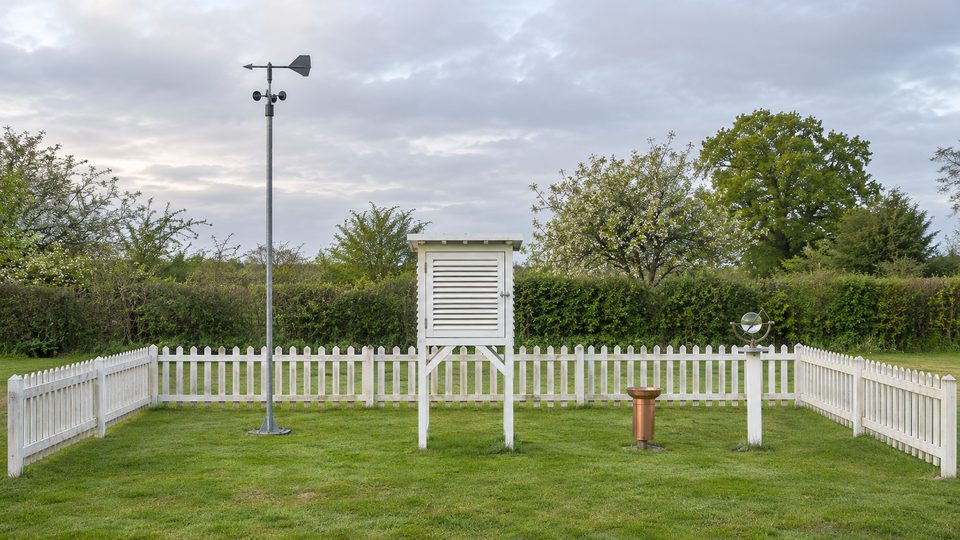
A garden weather station of the old kind, where an observer goes out at 9 every morning and reads the instruments by eye. Two plain thermometers, one with its bulb kept wet, give the humidity and the dew point. A glass ball burns a line on a card wherever the sun shone. Then the wind, the barograph, why forecasts can't see far ahead, and a forecast in the style of the inshore waters forecast. The weather is made up by the page, a week at a time; the instruments and the sums are real.
One clock runs through the week: moving the time on any tab moves it on all of them. Choosing a morning on THE SCREEN sets it to 9 am that day; BROADCAST shows the latest forecast issued by then.
THE SCREEN : the register starts each morning empty for you to fill in; NEXT MORNING moves on to the next day. Click or tap a thermometer (or press LOOK) to see it close up and type what it says (to a tenth of a degree). Read the maximum and minimum thermometers, then RESET them for the next day. EMPTY the rain gauge into its measuring glass and read that. FETCH CARD brings in yesterday's sunshine card, taken out of the recorder after sunset (the card holds one day's sun): add up the burnt lengths. A tick means your reading matches the instrument. FILL IN FOR ME does it all. The humidity and dew point are worked out from your own two thermometer readings. SNAG spoils the readings in a way that really happens, and the line underneath says what the air really held.
WIND : the cup anemometer and the wind vane at the chosen time of the week. COUNT 10 MINUTES counts the turns of the cups over ten minutes (sped up), the way a wind reading is a ten-minute average, and turns the count into a speed with the factor you choose. The Beaufort scale shows the force, with what it looks like on land or at sea.
PRESSURE : a week on the barograph's drum. Slide the time, or press DRAW THE WEEK to watch the pen write it. The dial reads the pressure, its change over the last three hours and the wind, and gives a forecast by rules like the ones on old barometer dials; the line underneath says what the page's weather really did over the next 12 hours, and the score counts how often the rules got the rain right this week. In the page's weeks they often do no better than always giving the commoner answer: the pressure and wind at one place are a weak guide on their own.
BROADCAST : an inshore-style forecast for the next 24 hours, with an outlook for 24 more, in the order the Met Office uses: wind, sea state, weather, visibility. It is written at the time of issue from what could be known then: where each low and high was, how deep, and how it was moving, run forward with the small errors any forecaster has in how fast each will travel, which way it will drift and whether it will deepen. WHAT HAPPENED sets each line beside the page's real weather: right, close or wrong. The first 24 hours are usually right; the outlook goes wrong more often.
THE MODEL : Lewis Fry Richardson's forecast by hand, and Edward Lorenz's discovery of chaos. RUN starts 20 copies of Lorenz's three equations from almost the same point; the nudge sets how far apart they start. The note under the story counts how this week's forecasts on BROADCAST did.
YOUR READINGS : put in readings from your own thermometers, barometer or wind meter. Nothing you type is sent anywhere.
THE STORY
The louvred white box is the Stevenson screen, described in 1864 by Thomas Stevenson, the lighthouse engineer (and father of Robert Louis Stevenson). It shades the thermometers from the sun and the rain while letting the air through; in Britain the thermometers sit 1.25 metres above short grass. A thermometer whose bulb is wrapped in wet muslin usually reads lower than a dry one, because evaporation takes heat, and the drier the air the bigger the gap. The gap is a temperature difference, not the humidity itself: with the dry-bulb temperature, the air pressure and how well the bulb is ventilated, it gives the humidity. In saturated air they read the same; below freezing the wet bulb is coated in ice and behaves a little differently.
The sunshine recorder began with John Francis Campbell in the 1850s, a glass ball burning a track into a wooden bowl. George Gabriel Stokes changed it in 1879 to burn a card held in a metal frame, which is how it still works. The World Meteorological Organization now defines sunshine as direct sunlight stronger than 120 watts a square metre, a threshold chosen to match what burns these cards.
Francis Beaufort drew up his wind scale in 1805, aboard HMS Woolwich, for what the wind did to a sailing warship; the Royal Navy made it standard in ships' logs in the late 1830s. The descriptions for use on land are credited to George Simpson of the Met Office, and wind speeds were fitted to the numbers later. Thomas Romney Robinson of Armagh Observatory built his cup anemometer in 1846 and said the cups always went round at a third of the wind's speed, whatever their size. That was wrong: the factor depends on the cups and arms and lies between about two and a little over three, so many early records read too high.
Robert FitzRoy, who had captained HMS Beagle for Charles Darwin, ran the new Meteorological Department from 1854. After the Royal Charter storm of 25 and 26 October 1859, which wrecked that ship off Anglesey with the loss of hundreds of lives, he started storm warnings by telegraph in February 1861, and on 1 August 1861 The Times printed his first public weather forecast. In 1915 the London instrument makers Negretti and Zambra improved and patented a pocket forecaster designed by another inventor: turn its discs to the pressure, its trend and the wind, and a window showed the forecast.
Lewis Fry Richardson worked out a forecast by the laws of physics, by hand, during the First World War while serving with the Friends' Ambulance Unit in France. It was for six hours ahead from the observations of 7 am on 20 May 1910, and it took him weeks. It gave a pressure change of 145 hPa in six hours, which is impossible; he published it anyway, with his method, in Weather Prediction by Numerical Process (1922), and dreamt of a hall of 64,000 people calculating the world's weather. Peter Lynch later showed that the method was sound: smoothing the starting data, as modern models do, brings that change down to a realistic 3 hPa. In 1950 the ENIAC computer made the first successful computer forecasts.
In 1961 Edward Lorenz at MIT restarted a run of a small weather model (twelve variables) from a printout, typing 0.506 for a number the computer held as 0.506127. Before long the new run had nothing in common with the old. His 1963 paper, "Deterministic Nonperiodic Flow", showed the same thing in just three equations, cut down from Barry Saltzman's model of heated air rolling over (convection); his 1972 talk asked whether the flap of a butterfly's wings in Brazil could set off a tornado in Texas. This is why forecasters now run their models many times from slightly different starts, an ensemble, and why the spread of the runs says how sure a forecast is.
The Shipping Forecast has been read on BBC radio since the 1920s; it is broadcast on BBC Radio 4. The Met Office also issues an inshore waters forecast four times a day for stretches of coast, and HM Coastguard broadcasts forecasts and warnings to boats on marine radio. Their wording is precise: "later" means more than 12 hours from the time of issue, "soon" six to 12 hours, and "imminent" within six.
HOW IT WORKS
Humidity uses the WMO's formulae. Saturation vapour pressure over water is 6.112 exp(17.62 t / (243.12 + t)) hPa, over ice 6.112 exp(22.46 t / (272.62 + t)), times an enhancement factor for moist air (about 1.005 at sea level). The air's vapour pressure is e = es (wet bulb) − A × pressure × (dry − wet). The coefficient A depends on how fast air passes the wet bulb: for an aspirated or whirled psychrometer 6.53 × 10⁻⁴ (1 + 0.000944 × wet) per degree (5.75 × 10⁻⁴ for an iced bulb); for a screen with only natural air the WMO's guide gives 7.7 to 8.0 × 10⁻⁴ (6.8 to 7.2 iced), and this page uses 7.99 × 10⁻⁴ and 7.20 × 10⁻⁴ per degree. In still air the right value is larger and less certain. Relative humidity is e over the saturation value at the dry-bulb temperature; the dew point is the temperature at which e would saturate. A wet bulb below 0 °C is taken to be iced.
Sunshine : the sun's height from its declination (Cooper's formula) and the hour, the path through the air from Kasten and Young's air-mass formula, and the strength of the direct beam from Meinel and Meinel's rule, adapted to today's value for the sun's strength: 1361 × 0.7(air mass0.678 ) W/m². The card burns, minute by minute, where that beam (reduced by thin high cloud, stopped by thick cloud) passes 120 W/m². The card is marked in solar time, as the sun keeps it.
The weather is a small honest pattern, not a forecast model. Lows and highs, each a smooth bump or dip of pressure, drift past the station from the west. The wind comes from the pressure pattern: the geostrophic wind, which blows along the isobars at a speed set by how tightly they are packed and the Earth's spin, with low pressure on its left; near the ground it is slowed to about half over land and 0.7 over the sea, and turned 30 and 15 degrees towards the low (rules of thumb). Each low carries the textbook pattern of a warm front, a warm sector and a cold front: a broad band of rain ahead of the warm front, mild murky air with drizzle behind it, a short burst of heavy rain at the cold front, then fresher air with showers, more by day. Temperatures follow the season, the air mass, the sun and the cloud, with clear calm nights cooling most. The sea is the Met Office's probable wave height for the wind's force, smaller when the wind blows off the land, and slow to rise and fall.
The forecast words come from the Met Office's marine glossary: sea states by wave height (slight 0.5 to 1.25 m, moderate to 2.5 m, rough to 4 m...), visibility (good over 5 nautical miles, moderate 2 to 5, poor 1,000 m to 2 miles, very poor under 1,000 m) and pressure trends over three hours (slowly 0.1 to 1.5 hPa, plain rising or falling to 3.5, quickly to 6, very rapidly beyond).
Chaos : Lorenz's equations dx/dt = 10 (y − x), dy/dt = x (28 − z) − y, dz/dt = xy − 8z/3, stepped by the Runge–Kutta method. On average a small gap between runs grows about 2.5 times every time unit (the Lyapunov exponent, about 0.9); for a while two runs can close up or part faster than that. So, on average, a start a thousand times more exact buys only about 7.6 more time units of agreement (the page's 20 runs give a figure near that).
WHERE IT SIMPLIFIES
The weather is made up and simpler than the real thing: no hills, no sea breezes, no thunderstorms, and showers fall at random behind cold fronts. Clock times are solar time. The snags' sizes are this page's own rough figures: a sunny wall or tarmac can add a degree or more, but by how much depends on the site. The barometer rules are the page's own, in the spirit of the old dials, and they are scored against the page's own weather, not the real thing. The forecaster's errors are the page's own: real ones come from gaps in the observations and from the models themselves, not only from where the lows go.
FURTHER WATCHING AND READING