×
About Colour Blindness
About 8 in 100 men and about 1 in 200 women of northern European descent see red and green differently from everyone else (the share is usually lower elsewhere: around 4 to 6.5 in 100 men in Chinese and Japanese surveys). Many don't know until they are tested. This page shows what they see, and why.
This is not a medical test. Screens differ in their colours and brightness, and the plates and caps here are made for this page, not the printed originals an optician uses under the right light. If you think your colour vision is unusual, an optician can test it properly.
TESTS : PLATES are eight dotted plates made by this page, in the spirit of Ishihara's. Type what number you see (or press NOTHING), and the record card fills in. SHOW WHAT OTHERS READ reveals what the page's model predicts a simulated viewer of each kind can make out on each plate; VIEW AS redraws the plate as that viewer would see it, so you can watch a number disappear. Plate 4 holds two numbers at once, plate 5 is designed to be easier for red-green colour blindness than for normal vision, and plate 6 is designed to separate the two kinds of red-green colour blindness. These are the design and the model's predictions; how real people read them on your screen isn't known. ARRANGE is a version of the Farnsworth D-15 test: put the 15 coloured caps in order of colour, starting from the one next to the fixed cap. Click (or tap) a loose cap to put it in the next space, and a placed cap to take it back. The card draws your order on the circle of cap colours and scores it. LET A SIMULATED EYE TRY has a simulated viewer sort the caps the same way: always picking the cap that looks closest to the last one.
SEE IT : photos of a market stall, a garden border and a football match (made for this page), a speed map drawn with the same red-amber-green speed scale as this site's Phantom Jam, your own picture (open it, drop it or paste it: it never leaves your computer) or your camera (only after you press START CAMERA; STOP turns it off). Pick the kind and how strong it is; drag the white line to compare. Point at the picture to see one colour both ways.
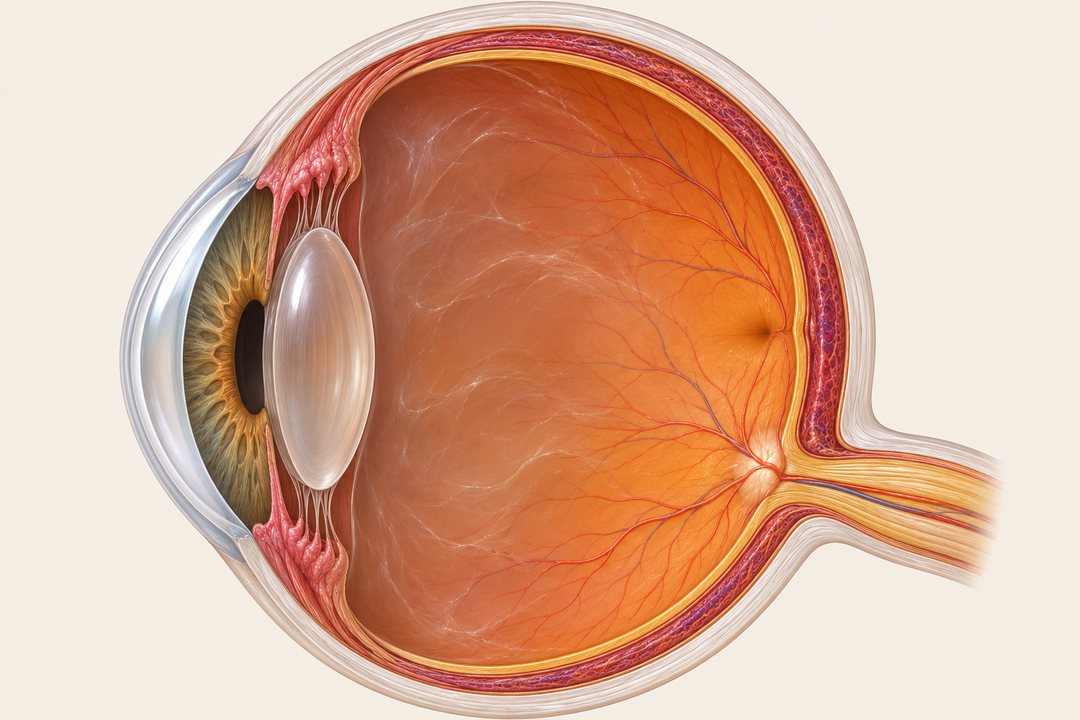
THE EYE : where the cones are, and the three kinds of cone: how strongly each answers light of each wavelength (each curve scaled to its own peak). Pick a kind of colour vision to see which curve moves or goes, and how the rainbow looks with it.
INHERITANCE : why red-green colour blindness runs from grandfather to grandson. Set the parents and the page works out the chances for each son and daughter.
THE STORY
The chemist John Dalton described his own colour vision to the Manchester Literary and Philosophical Society in 1794, in a paper published in 1798: a pink flower looked sky blue to him by day and red by candlelight, and his brother saw colours the same way. He guessed that the clear jelly in his eye was tinted blue and asked for his eyes to be examined after his death. They were, in 1844, and the jelly was clear. His preserved eye was tested again in 1995 by a team in Cambridge and London, who read the genes of his cones from its DNA: he was a deuteranope, with no working medium-wave (green) cones, not the protanope that his own descriptions had long been taken to suggest.
In November 1875 two trains collided at Lagerlunda in Sweden and nine people died. The physiologist Frithiof Holmgren suggested that colour blindness in the driver or another railwayman might have played a part (both men involved had died, so they could never be tested), and he tested the line's staff with his skeins of coloured wool, finding 13 colour-blind among 266. Colour testing of railway and shipping staff spread across Europe and America after that. Later historians, notably John Mollon and Lucy Cavonius in 2012, argue that the accident cannot simply be put down to colour blindness; the screening was a good idea all the same.
Shinobu Ishihara, an ophthalmologist in the Japanese army, published his dotted plates in 1917, and versions of them are still used. Dean Farnsworth published the 15-cap D-15 arrangement test in 1947.
On Pingelap, an atoll in Micronesia, a typhoon around 1775 left only about 20 survivors. One of them is thought to have carried a gene for achromatopsia, where the cones don't work at all: people see no colour, are dazzled by daylight and have poor sharpness of sight. With so few ancestors the gene became common, and today roughly 5 to 10 in 100 islanders have achromatopsia, against about 1 in 30,000 elsewhere. Oliver Sacks wrote about the island in The Island of the Colorblind (1996).
HOW IT WORKS
Three cones. Colour vision starts with three kinds of cone in the retina: long-wave (L, often called red), medium-wave (M, green) and short-wave (S, blue). Each answers a broad range of wavelengths; colour is worked out from how the three answers compare. The curves on THE EYE are Stockman and Sharpe's 2000 cone fundamentals for the central 2 degrees of vision, from the Colour & Vision Research Laboratory's tables (5 nm steps), and the rainbow strip uses the CIE 2006 colour-matching functions made from them.
Kinds. No working L cone class (the cells may still be there, but none does the L job): protanopia; L cones shifted towards M: protanomaly. No working M cones: deuteranopia; shifted: deuteranomaly, the commonest kind (about 5 in 100 men of northern European descent; protanopia, protanomaly and deuteranopia are each roughly 1 in 100). These four are "red-green". No working or faulty S cones: tritanopia and tritanomaly; the inherited kind is rare (estimates vary from about 1 in 10,000 to much rarer) and not linked to sex. Complete achromatopsia (no working cones at all) affects about 1 in 30,000; incomplete forms keep some cone function. Someone with an anomalous kind may be only slightly affected or nearly as affected as the full loss. Colour vision can also change during life, through eye disease, other illness or some medicines: new or worsening changes should be checked by an optician or doctor.
Simulation. A photo is turned from sRGB into linear light, multiplied by a 3 by 3 matrix, and turned back. The default matrices are Machado, Oliveira and Fernandes's (2009): their model moves the faulty cone's curve towards its neighbour (up to 20 nm for L and M), with severity 0 to 100% (100% = the full loss); the page uses the authors' published matrices at every tenth and blends between them, as they suggest. Brettel, Viénot and Mollon's 1997 method and Viénot, Brettel and Mollon's 1999 simplification are offered too; they model the full loss and blend towards it for lower severities. Brettel's numbers are the precomputed ones from the libDaltonLens reference code; Viénot's are worked out by the page from the Smith and Pokorny cones and match libDaltonLens's to 5 decimal places. Machado's and Viénot's are less faithful for tritans than Brettel's. The NO COLOUR view is plain greyscale: an illustration of losing all colour, not a model of how people with achromatopsia see (it leaves out their glare and blur). All of these show what a dichromat confuses, mapped onto colours you can see; nobody can show what another person actually experiences.
The plates are this page's own. Dots of many sizes are packed into a disc, each a little lighter or darker at random. A number is drawn by moving the colour of the dots inside it along a direction that leaves the screen brightness unchanged, so number and background dots have the same spread of brightness (the tests check this for every plate except plate 1, whose number is darker on purpose). That direction is picked by searching all of those for the one the simulated viewers notice least compared with normal vision (Machado's and Brettel's full losses; for tritans Brettel's alone, which is also what VIEW AS uses for them). So the model predicts a dichromat of that kind gets almost no difference to go on, while normal vision sees red against green. Screen brightness is matched for normal vision; a protan sees reds a little darker, which the random brightness of the dots is there to hide. No single direction hides a number from protans and deutans perfectly: the red-green plates are a compromise, and on some screens some people with milder colour blindness will read them. The answers in the other columns on the card are predictions: what the simulated viewers should be able to make out, worked out from the colour difference between the number and the dots around it as each sees it. A model like this can't establish what real people read, and it isn't the scoring of a clinical test.
The caps use the Munsell notations of the 15 D-15 caps (value 5, chroma 4; the fixed cap chroma 6) and their colour coordinates under illuminant C as tabulated from Farnsworth's 1947 manual; the page turns those into screen colours, which are approximations of the real painted caps. Scoring follows Vingrys and King-Smith (1988): the steps between neighbouring caps in your order, measured in CIELUV colour space, give an angle (the direction of the errors: protan about +3 to +17 degrees, deutan about -4 to -11, tritan towards -80 and beyond), a C-index (1 for a perfect order, larger for more confusion) and an S-index (how lined up the errors are along one direction). The card's reading is approximate: a C-index under 1.6 counts as no substantial arrangement error (which says nothing more about colour vision); an S-index under 1.8, or an angle outside about +1 to +20 (protan), -1 to -16 (deutan) or steeper than 65 degrees (tritan), is "no clear direction". "Jumps" is the page's own simple count of steps that skip more than two cap positions, not a clinical score. The simulated eye's arrangements give the textbook patterns.
Inheritance. The genes for the L and M cones (OPN1LW and OPN1MW) sit side by side on the X chromosome. A man has one X, from his mother, so one faulty copy is enough. A woman has two, and usually needs both to be faulty; with one she is a carrier, often with normal colour vision. So a colour-blind man passes the gene to every daughter (each a carrier, or colour-blind herself if her mother passes on a faulty X too) and to no son, and a carrier mother passes it to half her sons on average. If 8 in 100 men carry it, the sum says about 8% of 8% = 0.64 in 100 women should be colour-blind and about 15 in 100 should be carriers; surveys find about 0.4 in 100 women colour-blind, partly because a woman with a faulty L gene on one X and a faulty M gene on the other usually sees normally. The calculator assumes the same inherited defect throughout the family (all protan or all deutan) and full effect. If one parent passes on a protan X and the other a deutan X, a daughter usually sees normally, which these odds don't show; and the strength varies.
FURTHER WATCHING AND READING